
 January 25, 2017 by Jean Paul Lagarde – With the Presidential inauguration behind us, let us examine the state of the U.S. economy and the market’s expectations of it. As we highlighted in the December investment note, the economy has, in fact, accelerated since the recent low in GDP growth of 1.3% year-over-year in the second quarter of 2016, which was the culmination of five sequential quarters of S&P 500 revenue and profit declines. A negative streak of this length had not shown its ugly head since the depths of 2009 when the economy was struggling to emerge from the snares of the great recession.
It was then though that the economy started to build steam. Third quarter GDP which was announced in October showed both a sequential and year-over-year acceleration. There was concern, however, that the forces driving third quarter growth were transitory since much of the economic data was rather muted. That said, the economic data since early November, as we previously highlighted, has been decidedly positive. This trend has continued into the new year which further confirms the view of “growth for now.” We are embracing the growth but doing so with caution.
On the labor front, Average Hourly Earnings for December accelerated to a new cycle high of 2.9% growth year-over-year versus November’s reading of 2.5%. Non-farm Payroll growth continues to slow from the cycle high of 2.3% in February 2015, growing 1.5% in December with an addition of 156,000 jobs. The slowdown in job growth has moderated, and given that we are facing easier comparisons in the coming months, particularly in May when payrolls grew by only 24,000 jobs for the month last year, the prospect of non-farm payroll growth in the near-term is significantly higher.
The industrial sector, being very cyclical, is generally one of the first sectors to accelerate or decelerate based on the economic cycle, being an “early” cycle play. That said, the sector started slowing in the latter half of 2015 culminating in a year-over-year decline of -2.3% in Industrial Production for December 2015 which we highlighted in our last note. Since then the declines have been less negative with October and November being down -0.8% and -0.6%, respectively. December data was very notable as it reversed course posting positive growth of 0.51% year-over-year, the first growth since August 2015.
Other notable December data are the Markit US Manufacturing Purchasing Manager’s Index improving in December to 54.3 versus 43.2 in November, and Capacity Utilization improving to 75.5% from 75%. Additionally, ISM (Institute of Supply Chain Managers) Manufacturing survey for December came in at 54.7 relative to 53.2 in November, while Markit’s US Composite Purchasing Manager’s Index rose to 54.1 from 53.7 over the same time period. These surveys are utilized as a gauge of what is to come as they are more forward looking in nature.
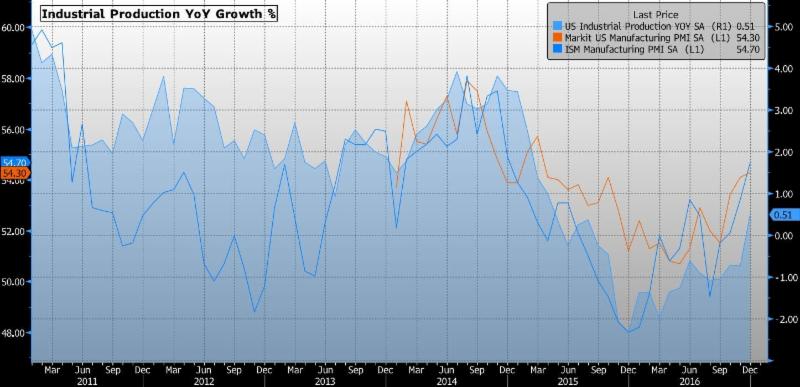
Figure 1: Industrial Production Growth & Purchasing Managers Surveys that Portend Additional Growth
The Producer Price Index (PPI), a measurement of output prices for companies has continued to improve after being negative for much of 2015 and the beginning of 2016. Following 0% growth in both July and August, PPI improved in September, October, and November by 0.7%, 0.8% and 1.3%, respectively. Most recently, December PPI climbed 1.6%. We expect this trend to continue as oil prices remain elevated. An improving PPI bodes well for earnings and GDP. Looking at “core” PPI which strips out the more volatile food and energy components, we saw the second consecutive month of 1.6% growth, matching the broader PPI measurement.
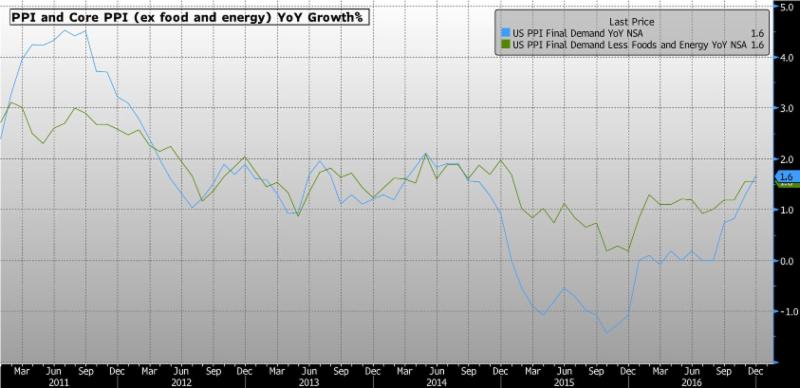
Figure 2: Producer Price Index Denotes Demand and Growth in Price Inflation
With regard to the general level of price and inflation, the Consumer Price Index, grew 2.1% year-over-year in December, which was the highest growth rate since June of 2014. Core CPI, excluding food and energy, grew at a rate of 2.2% year-over-year in December. Having both CPI and core CPI above 2% is a new development.
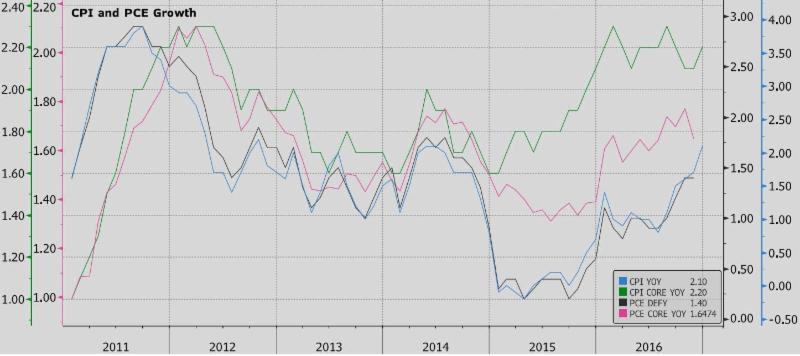
Figure 3: CPI and CORE CPI Now above 2% with PCE Lagging
CPI being above two percent gives at least a certain level of credibility to inflation expectations evident in the increase in the Fed’s Five Year Forward Inflation Expectations.
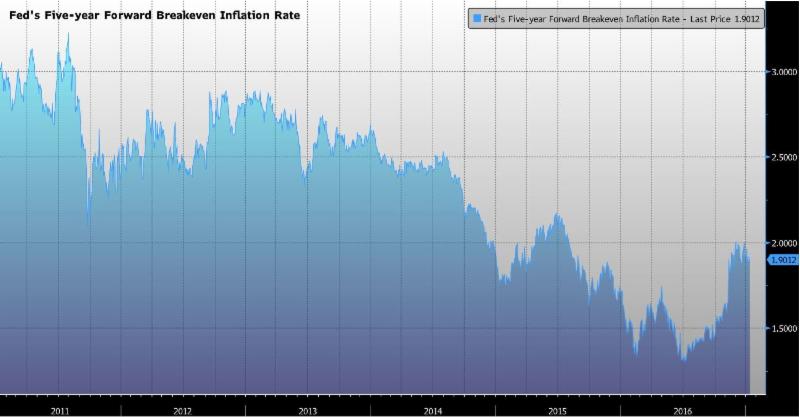
Figure 4: Fed’s Five Year Inflation Rate Demonstrates Rising Inflation Expectations
There is a very high positive correlation between inflation expectations and yields, which are negative for bond prices. Below you can see the rise in yields following the rise in inflation expectations measured by the Fed’s Five Year Forward Curve.
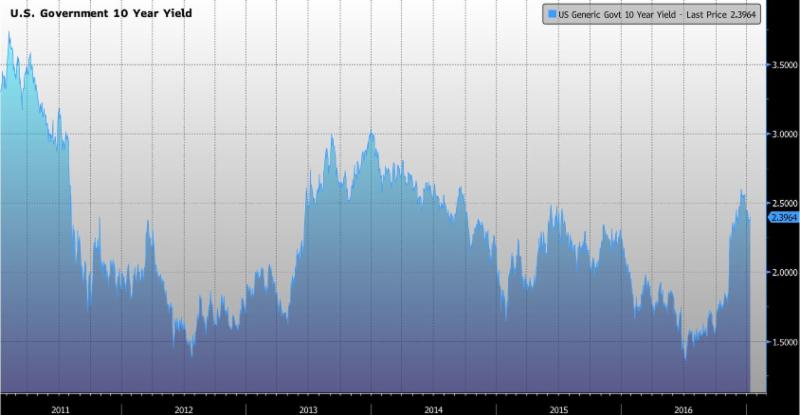
Figure 5: Yields Rise as Inflation Expectations Rise
This has also caused the yield curve, the difference in yield between the long end of the treasury curve and the shorter end which is a classic signal for inflation and growth.
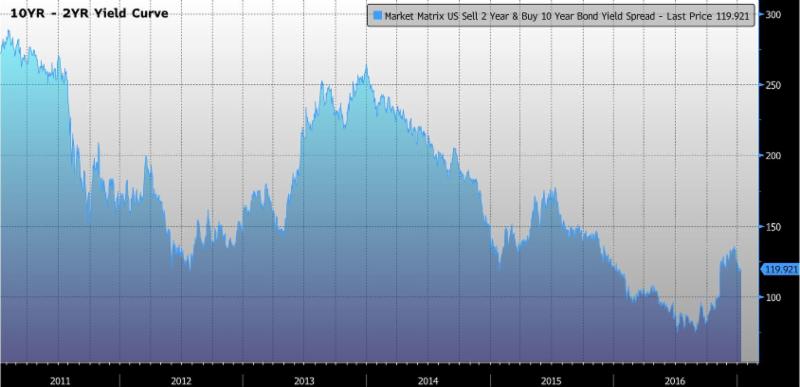
Figure 6: Yield Curve Steepening Confirms Rising Inflation Expectations and Anticipates Growth
With inflation expectations and yields increasing, the dollar has continued to strengthen; and we believe this trend with continue.
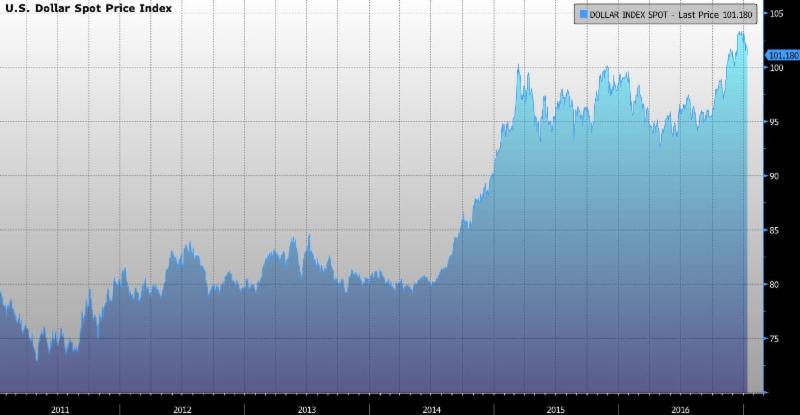
Figure 7: Dollar Strengthening in the Face of Higher Rates
Considering the positive data, the question of sustainability comes to mind. We have argued that without a fundamental shift in behavior for both consumers and businesses the economy was more likely to continue slowing based on secular demographic challenges, only worsened by a systemic lack of capital investment which further challenged productivity and ultimately growth.
With that consideration in mind, we have been encouraged by the shift in sentiment. Specifically, consumer and business confidence continues to climb. The Conference Board’s Consumer Confidence survey increased to 113.7 in December versus a reading of 109.4 in November and 100.8 in October. University of Michigan sentiment in January came in at 98.1 versus 98.2 in December and 83.8 in November. NFIB Small Business Optimism increased dramatically in December to 105.8 from 98.4 which was the highest reading since December 2004.
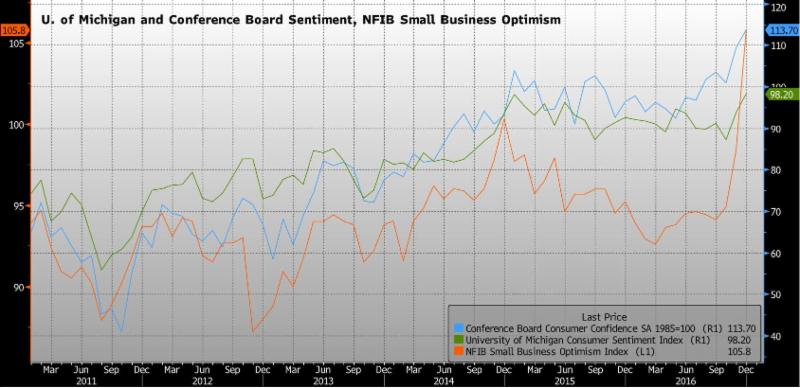
Figure 8: Consumer Confidence and Business Optimism Rising
Positive growth, as measured by accelerating GDP and improving corporate revenues and profits, combined with improving higher frequency economic data reported weekly and/or monthly, has turned into a bit of a cupcake with the sprinkles on top being improving consumer and business confidence.
In the face of such a tantalizing treat, how can the market not take at least a nibble of the growth accelerating treat? It most definitely has.
If we look at volatility, a classic measure of risk, the cake crumbs are evident. Examining realized volatility – risk that has already occurred – relative to implied volatility – which a measure of expected risk, we can see that the market is rather “bought in” to the growth story, as fear which manifests itself in volatility seems rather subdued since these metrics are trending downward, somewhat substantially since November.
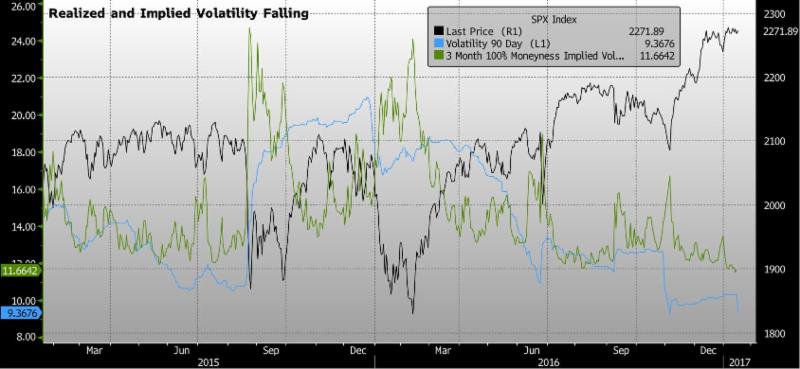
Figure 9: Realized and Implied Volatility – a Measure of Risk – Declining
Further evidence of risk complacency is the material decline in the VIX, broadly considered the fear gauge which is derived from S&P 500 volatility.
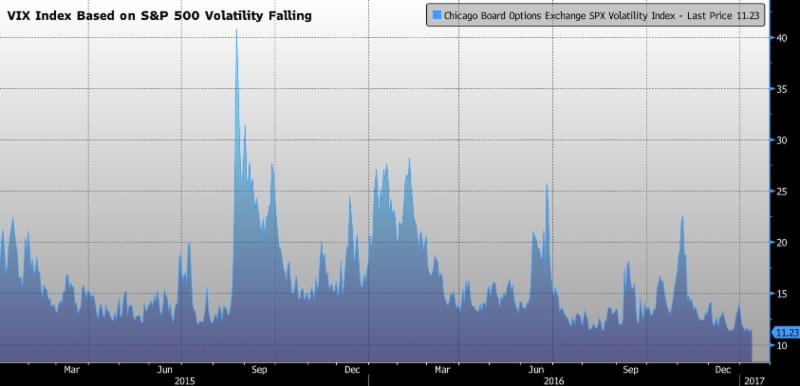
Figure 10: VIX Index – Often Referred to as the Fear Gauge – Falling
The nibbling is further manifested in the investment preferences of the market as of late. If we measure these preferences in terms of style factors we can see that before November, when the growth slowing thesis was more of a reality, the market preferred lower beta (lower risk) investments. Stocks or portfolios with beta less than one possess less risk than the market (which has a beta of one), and investments with a beta greater than one possess more risk than the market. During this period, lower beta names outperformed higher risk, higher beta, investments. Low beta names are typically large established companies that typically pay a stable dividend such as utility companies and consumer staples.
As the market shifted to growth, higher-beta names have outperformed while low-beta names have underperformed. This is because stable dividend income from low-beta (safer) names are less desirable in a period of economic growth as investors seek out faster growing companies.
This is also playing out in terms of stock indices with the small cap Russell 2000 index outperforming both the S&P 500 and the NASDAQ composite since the election.
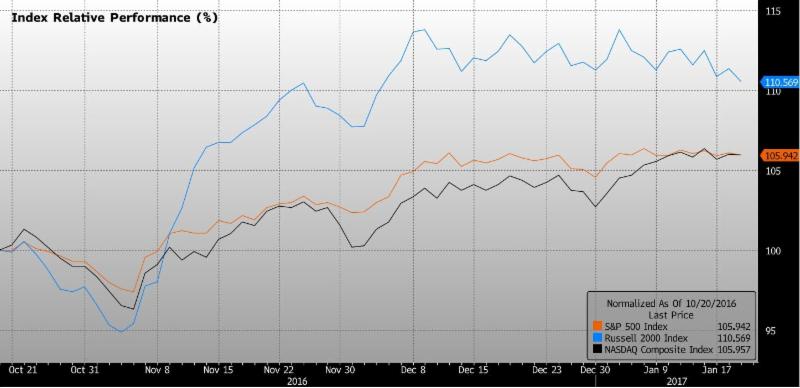
Figure 11: Higher Beta Russell 2000 Index Outperforming
It is true that after being relatively bearish on the market at the end of 2015 and the majority of 2016, until the week after the election, we are cautiously optimistic on the economic outlook. We prefer to delve into vast array of economic data for answers, rather than relying on the consensus view which we often find uninformed and risky since, by definition, consensus is how the majority of investors are positioned. When the scale tips, it generally does so quickly.
Challenges do lie ahead and the market may be overestimating the President’s ability to quickly pass his agenda through congress. In terms of his $1 trillion in infrastructure spending, it will take time for the programs to trickle down into actual projects. The funds will need to flow from the Federal Government into the hands of the individual states, which will then translate into projects. It is also doubtful that there will be a plethora of “shovel ready” projects at hand, thus it will most likely take a two to three years to begin en mass.
We will be watching other agenda items such as tax and regulation reform as well as the ability of the President to repeal the Affordable Care Act which will all no doubt affect the market.
As always our goal is to navigate markets intelligently, and most importantly, manage risk. This allows our clients to stay fully invested through the market cycles by employing specific strategies that aim to participate in market upswings, while also aiming to reduce the ill effects of market downswings that can be so devastating.
We continue to believe that a classic stock bond asset allocation will suffer in the current environment as interest rates will likely climb creating a drag for fixed income investments.
For now, let the market have its cake.
Cupcakes with Sprinkles on Top – Key Takeaways
- The economic data since early November, as we highlighted in the December note, has been decidedly positive. This trend has continued into the new year which further confirms the view of “growth for now.” We are embracing the growth but doing so with caution.
- Positive growth, as measured by accelerating GDP and improving corporate revenues and profits, combined with improving higher frequency economic data reported weekly and/or monthly, has turned into a bit of a cupcake with the sprinkles on top being improving consumer and business confidence.
- As the market shifted to growth, higher-beta names have outperformed while low-beta names have underperformed.
- Challenges do lie ahead and the market may be overestimating the President’s ability to quickly pass his agenda through congress.
- We continue to believe that a classic stock bond asset allocation will suffer in the current environment as interest rates will likely climb creating a drag for fixed income investments.
Disclosure
The opinions voiced in this material are for general information only and are not intended to provide specific advice or recommendations for any individual. Economic forecasts set forth may not develop as predicted and there can be no guarantee that strategies promoted will be successful. No strategy, including asset allocation or Modern Portfolio Theory, assures success or protects against loss. All performance referenced is historical and is no guarantee of future results.
All indices are unmanaged and may not be invested into directly. The Standard & Poor’s 500 Index is a capitalization weighted index of 500 stocks designed to measure performance of the broad domestic economy through changes in the aggregate market value of 500 stocks representing all major industries. The Russell 2000 Index is an unmanaged index generally representative of the 2,000 smallest companies in the Russell 3000 Index, which represents approximately 10% of the total market capitalization of the Russell 3000 Index. The NASDAQ Composite Index measures all NASDAQ domestic and non-U.S. based common stocks listed on The NASDAQ Stock Market. The market value, the last sale price multiplied by total shares outstanding, is calculated throughout the trading day, and is related to the total value of the Index.
Stock investing involves risk including loss of principal. The payment of dividends is not guaranteed. Companies may reduce or eliminate the payment of dividends at any given time. Bonds are subject to market and interest rate risk if sold prior to maturity. Bond values will decline as interest rates rise and bonds are subject to availability and change in price. High yield/junk bonds (grade BB or below) are not investment grade securities, and are subject to higher interest rate, credit, and liquidity risks than those graded BBB and above. They generally should be part of a diversified portfolio for sophisticated investors. Duration is a measure of the sensitivity of the price (the value of principal) of a fixed income investment to a change in interest rates. It is expressed as a number of years. Rising interest rates mean falling bond prices, while declining interest rates mean rising bond prices. The bigger the duration number, the greater the interest rate risk or reward for bond prices. Government bonds and Treasury bills are guaranteed by the US government as to the timely payment of principal and interest and, if held to maturity, offer a fixed rate of return and fixed principal value.
Securities offered through LPL Financial. Member FINRA/SIPC. Investment advice offered through Level Four Advisory Services, LLC, a registered investment advisor. Level Four Advisory Services, LLC and Faubourg Private Wealth Advisors are separate entities from LPL Financial.