
 March 24, 2017 by Jean Paul Lagarde – Since our last note “Cupcakes with Sprinkles on Top” the economic data continues to improve which we believe will support rising GDP estimates and inflation which is bullish for stocks and bearish for fixed income. Our stance continues to be growth for now, and embracing said growth with caution.
In late January, preliminary GDP for 4Q2016 was released which showed an increase of 1.9% on a quarter-over-quarter annualized basis. This was weaker than we had expected, yet the figure was lower due to the less meaningful “net-exports” calculation being -1.7% (the biggest negative impact since 2010). The very important consumer spending component which represents over 70% of the economy was quite strong at 2.5%. Since its initial release in late January, the consumer spending figure was revised upward to 3.0% in late February – GDP and related figures come out in four stages: initial estimates, second, third, and then the final report. Net-net we saw growth accelerate in the fourth quarter with GDP. If measured on a year-over-year basis, growth was also 1.9%, which was significantly stronger than the cycle low of 1.3% in the second quarter of 2016.
On the price front, inflation and inflation expectations continue to rise with CPI (Consumer Price Index) posting a year-over-year increase of 2.5% in January, the highest reading since March 2012, which was then followed by a February report of 2.7%. Core CPI which strips out the more volatile food and energy prices rose 2.3% in January versus 2.2% in December. The February Core CPI reading of 2.3% was later revised in March to 2.2% down 0.1% from January. Although this level matched price growth in August and February 2016, to find this level of inflation prior to that, you would have to go back to January 2012 as measured by the CPI. The PCE price index, also known as the “Deflator for Personal Consumption Expenditures” measured growth of 1.7% in January, which was the highest reading since September 2014. And lastly, the Federal Reserve’s preferred metric of price inflation the Core PCE, which strips out food and energy prices, rose 1.7% in January.
It’s hard to deny from the graph below which highlights all four price gauges, that the general level of price is rising and that even the lagging PCEs could possibly exceed the Fed’s 2% target in the not too distant future.
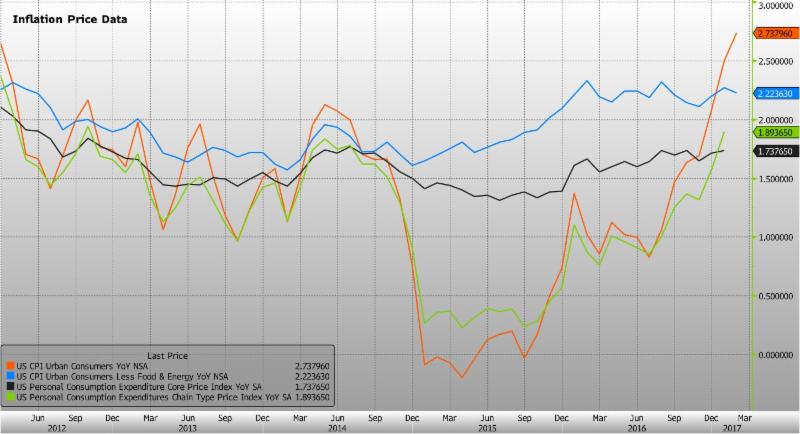
Figure 1: CPI and PCE Price Growth Accelerating – Bloomberg Data
If we look at price from a different angle, in terms of prices paid or received by corporations, we see similar results.
The Institute of Supply Management releases the Prices Paid index, which measures price sentiment across the 300 companies in the U.S., and is a barometer for future inflation for businesses regarding their input materials. The January report of 69.0 is the highest reading since May of 2011. The February Prices Paid report was also elevated at 68.0.
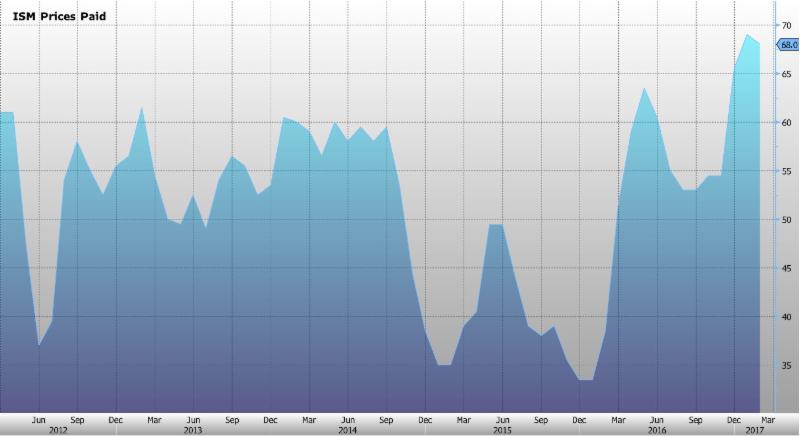
Figure 2: Institute of Supply Management Prices Paid Index – Bloomberg Data
The Producer Price Index (PPI) from the Bureau of Labor Statistics measures price changes for goods produced and services rendered to their final recipients whether that be personal consumption, business investment, government spending, or export. The January reading for PPI Final Demand was 1.6% year-over-year while the February reading registered 2.2% the highest reading since March 2012.
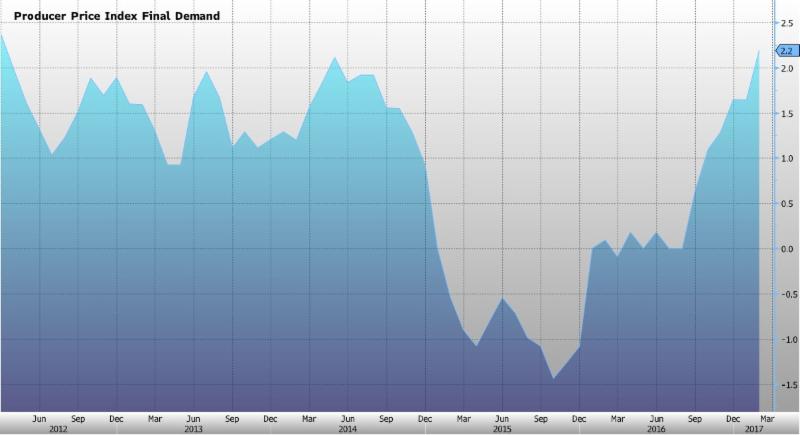
Figure 3: U.S. Producer Price Index Final Demand – Bloomberg Data
PPI Final Demand ex-food and energy shows a similar pattern posting growth of 1.2% year-over-year in January and 1.5% in February.
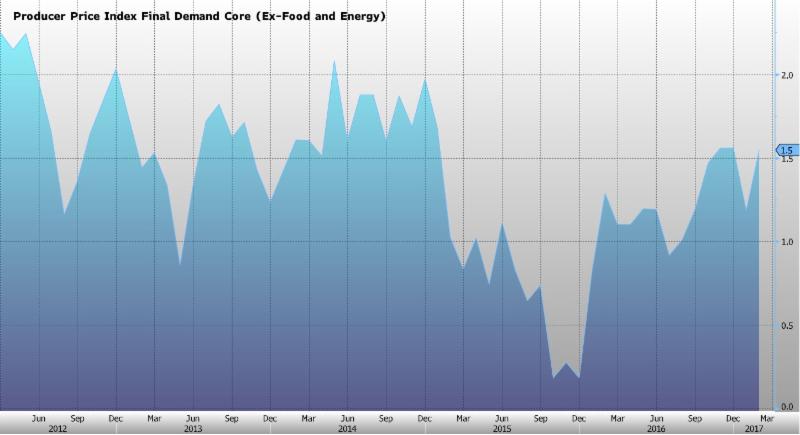
Figure 4: U.S. Producer Price Index Ex-Food and Energy – Bloomberg Data
We believe that GDP will continue to grow, while the growth rate in inflation may decelerate after the first quarter.
Another interesting data point since our last comment was the fact that the labor market accelerated first the first time in 23 months, positing Non-Farm Payroll job growth of 227,000 jobs in January which equated to 1.65% growth year-over-year versus 1.5% in December. Growth was also sustained in the February Non-Farm Payrolls report of 235,000 jobs. We believe payroll growth has a high percentage chance of continuing to grow on a year-over-year basis through May due to relatively easy comparisons in 2016.
Additionally, wages grew for 80% of the labor force by 2.9% which will support consumer spending, although the headline measure of wage growth, average hourly earnings were 2.5% in January versus 2.8% in December. In February, average hourly earnings increased to 2.8% year-over-year.
Likewise, consumer spending is growing and should positively impact GDP. Consumer spending measured by “retail sales” grew 6.0% in January on a year-over-year basis while February while February measured 5.7% over the same time period.
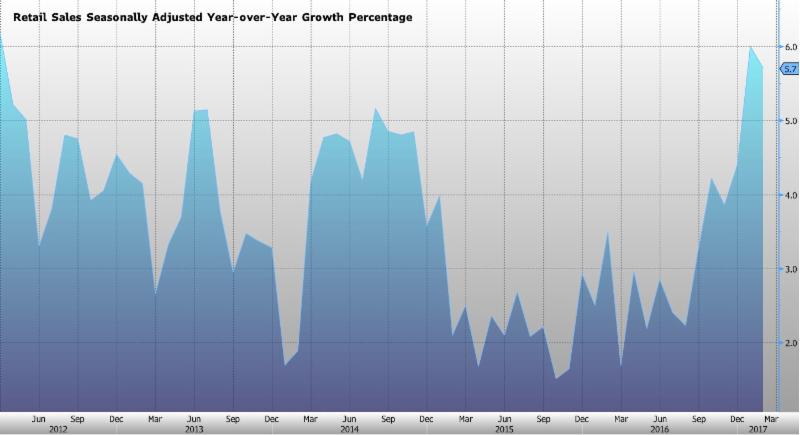
Figure 5: U.S. Retail Sales Year-over-Year Growth Percentage, Seasonally Adjusted – Bloomberg Data
The Retail Sales Control Group which directly filters into GDP calculations grew 4.4% year-over-year in January and 4.0% in February which compares favorably versus 3.4% in December. This positively impacts our expectations for GDP for the first quarter which will be released, on a preliminary basis, in April.
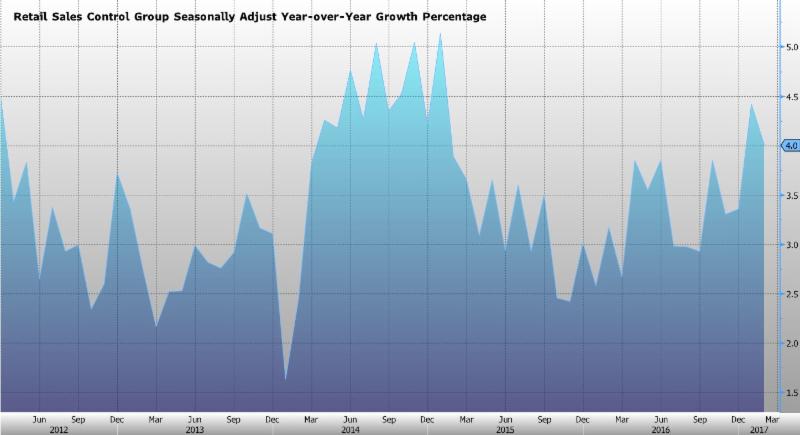
Figure 6: U.S. Retail Sales Control Group Year-over-Year Growth Percentage, Seasonally Adjusted – Bloomberg Data
At this point given the data released, we are expecting 1Q2017 GDP to exceed current consensus estimates of 2.2% year-over-year and 2.3% on the often-quoted quarter-over-quarter annualized basis.
During the Federal Reserve’s Open Market Committee meeting on Wednesday March 15, 2017 the committee decided to raise interest rate by 0.25% to a range of 0.75% to 1.00% for the Fed Funds Rate. This is the rate at which the banks lend reserve balances to other banks overnight.
That said, the hike was still relatively “dovish.” The increase was all but priced into the market, with the futures market predicting a 100% chance of an increase. More important was the expectations of future rate increases. Given the spike in inflation some market participants were expecting more than a 25-basis point hike, or that the Fed would hint that more than three might be necessary for 2017, neither of which materialized.
Given that Chair Yellen indicated that the labor force had more room to run, and that this path of interest rate normalization was still “accommodative,” we believe the Fed will err on the side of fewer hikes than more to allow the economy to continue to grow.
With only 3 rate hikes for 2017 baked into the market’s expectations, unless the Fed talks tough on inflation, adopting a more “hawkish” stance and demonstrating a willingness to raise interest rates faster to stave off inflation, the market may fail to price in the potential for higher rates. These market expectations are critical as they have the power to raise rates through expectations before the Fed actually raises rates.
With that said, with dovish posturing causing the market to not price in significantly higher rates, the economy may be allowed to overheat which may ultimately force the Fed’s hand to act in a “catch up” fashion. At that point the danger would be that the Fed may raise rates too frequently by large degrees which might literally douse the fire and cause the next recession.
Ironically, with the Fed Funds rate now set at 0.75% and 1.00% for the lower and upper bound, respectively, the Taylor rule, proposed by economist John Taylor as an approximation of what the general level of interest rates given current and desired conditions, suggests that current rates should be set at 4.0% to prevent the economy from overheating which is very different from where rates are today.
The icing on the cake is that it is precisely economist John Taylor, who proposed the rule, that is thought to be one of the candidates considered by President Trump to occupy one of the vacant seats at the Fed.
The opinions voiced in this material are for general information only and are not intended to provide specific advice or recommendations for any individual. Economic forecasts set forth may not develop as predicted and there can be no guarantee that strategies promoted will be successful. All performance referenced is historical and is no guarantee of future results.