
 December 28, 2016 by Jean Paul Lagarde – Let the U.S. election and the market’s violent reactions downward, and then suddenly upward, serve as a not so gentle reminder that there is significant risk in the equity markets. Like a coiled spring, it can move dramatically in very short periods of time. The day after the election culminated in an 1100 point swing in the Dow Jones Industrial Average and a 144 point swing in the S&P 500 Index.
The reality of risk is, if you are an investor, you undeniably bear risk, and there is no getting around it. Portfolios can be engineered in an attempt to have more or less risk, however one has to question the engineering and methods. It is widely understood that the more risk you bear, the greater the potential reward and vice versa.
Risk is obviously undesirable unless it is risk to the upside that so many investors expect. Yet, when risk delivers sharp moves to the downside, it becomes a source of concern, often too late. Rapid moves up or down should indicate that the market and/or your portfolio have an elevated amount of risk. This portfolio risk can be mapped and measured, and we highly recommend doing so.
The classic approach to reduce risk employed by the many Wall Street and financial advisors is asset allocation (i.e. asset diversification). Sometimes, these come in the form of colorful pie charts outlining exposures to various asset classes such as equities, fixed income, commodities, international equities, and with an almost unlimited number of subcategories. The mix of assets depends in part on correlations.
Let’s examine the most basic approach to an asset-diversified portfolio, one with 60% equity exposure and 40% bond exposure. The reason this style of diversification is often utilized is that, more often than not, during “normal” markets, bonds and stocks are negatively correlated. What that means is that if equities sold off, bonds would increase in value so that not all the assets in a portfolio would go down at the same time.
These inverse relationships are based on past market behavior. Depending on the analysis period, some asset classes have strong negative (opposite) relationships, while others can have a more positive (same direction) relationship. According to Modern Portfolio Theory (a concept outlined by economist Harry Markowitz in the 1952), the asset diversified portfolio can (by combining assets with varying negative and positive relationships) increase the investment return, for a given amount of risk undertaken. The optimal mix of reward over risk being the “Efficient Frontier.” Per the theory, if you combine a mix of assets that have both negative and positive correlations, the overall “risk” of the portfolio decreases.
Herein lies the problem. The weakness in Asset Allocation stems from the fact that they are backwards looking. They derive correlations (positive and negative numbers, and the degree to which they are positive and negative) from specific periods of time in market history. Markets are always evolving, and, depending on where an economy is in the market cycle, various asset classes can have completely different relationships. Thus, you could have two securities such as stocks and bonds (60/40) that, during certain historical markets, have strong negative relationships, while during other periods of time/markets, they exhibit positive correlations. The investor who sought refuge in a 60% stock and 40% bond portfolio could be disappointed in the “protection” they were seeking, depending on which flavor of a market decline is being experienced.
An example of unexpected positive stock to bond correlation can be found in very recent history up until the recent U.S. Presidential election. Until that time, bonds and stocks had been selling off, moving in the same direction, often downward. This was partially due to what we call extreme monetary policy by major central banks around the world with the Federal Reserve, the Bank of Japan, Bank of England, People’s Bank of China, and the European Central Bank flooding the markets with cheap credit and abnormally low interest rates that were becoming systemic. These policies were enacted by the central banks to stave off the financial crisis of 2008. This had persisted up until December 2015 when the Federal Reserve raised the FED Funds rate by 0.25. That has been the singular raise since the financial crisis that ended almost 7 years ago. The Federal Reserve is now signaling that they will raise rates again next month by an additional 0.25%.
A certain element of risk can be defined as the probability of the improbable. When Donald Trump became the President-Elect, the markets were completely caught off guard, and risk grew exponentially. Following a rapid and steep sell off in the futures market (after hours), stocks rebounded but volatility (risk) remains elevated.
The election also sent reverberations through the bond markets compounding the effect that began with the Federal Reserve’s planned rate increase in December. Partially due to Trump’s economics plans of a $1 trillion spending spree on infrastructure, tax cuts across the board, re-hauling or repealing the Affordable Care Act, and potentially repealing the Dodd-Frank act currently encumbering domestic banks, inflation, and potentially growth expectations have dramatically increased. We can see this from the FED’s 5 Year Forward measure of inflation.
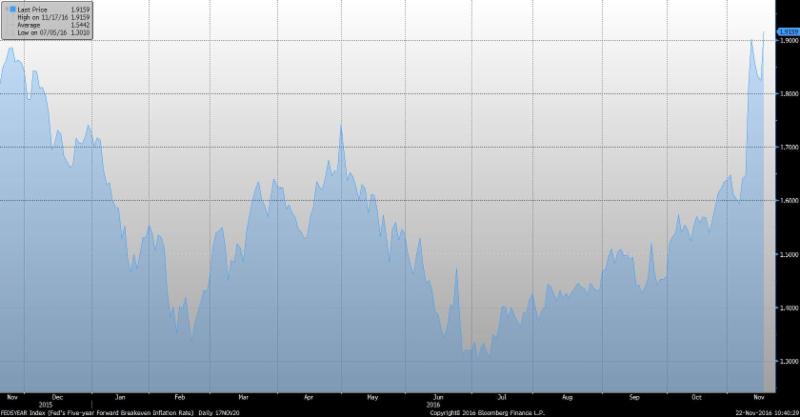
Figure 1: FED 5YR Forward Break even Inflation Rate – Bloomberg
With inflation expectations up dramatically, we can see from the yield curve that the short end (2 year yields) are up 17 basis points while the 10 year and 30 year yields are up 43 and 38 basis points, respectively on the long end, resulting in further steepening of the yield curve, which is an indication of inflation and possibly growth.
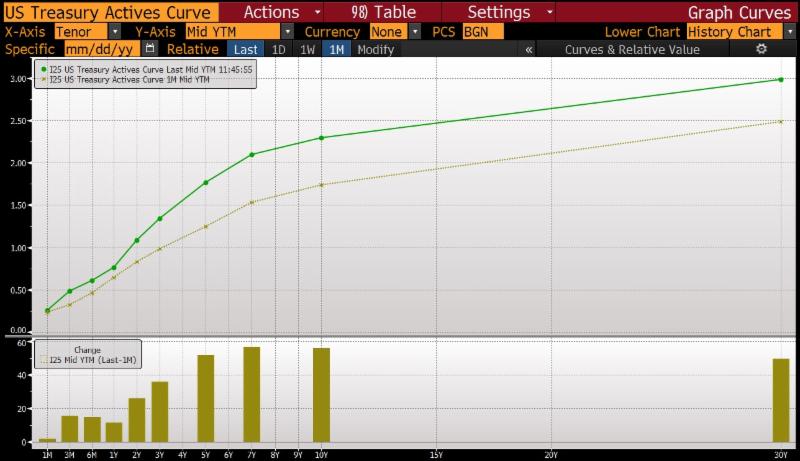
Figure 2: Treasury Yield Curve – Bloomberg
This has sent bond prices in aggregate down, depending on their interest rate sensitivities as measured by duration. If a bond portfolio had a duration of 7, the portfolio would lose approximately 7% of its value for each 1% increase in interest rates. The 10 year treasury has climbed from 1.36%, just four months ago, to a high of 2.30% (on an intra-day basis) on November 14th, which is a 69.1% increase.
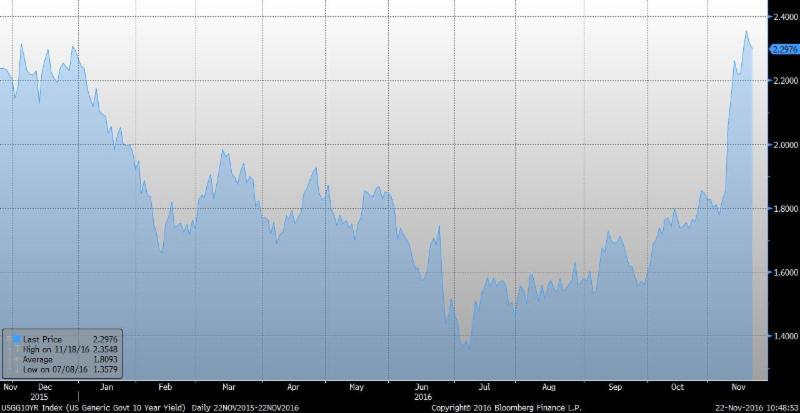
Figure 3: 10YR Treasury Yield – Bloomberg
Thus, in a 60% stock and 40% bond portfolio, the assets, since the recent election, have been positively correlated with stocks going up and bonds going down. It remains to be seen if this correlation with hold up, as nothing is certain.
At current market levels, we believe that equities have higher than normal risk due to stretched valuations, the increased debt burden of corporations, declining corporate profits, and a dramatic increase in interest rates, which negatively affect corporations’ abilities to service the larger debt loads. Jobs have continued to be created, but at a slower pace, and the consumer is showing signs of slowing down. We are also facing a secular stagnation trend where the country’s biggest spenders (the baby boomers) are preparing for retirement and spending less, while the younger generations have less disposable income to replace this spending. President-Elect Trump could potentially reignite growth, but the probability of such is still relatively low as he is not yet stepped foot into the oval office and his advisors have not released his plans for funding these expenditures.
Bonds on the other hand have an unusually skewed risk/reward profile due to the low prevailing level of interest. It might be improbable based on unfavorable demographics and domestic growth trends, but there is a chance that rates could continue to climb even several percentage points. Although this is not a likely scenario, if it did happen bond portfolios would have their own financial crisis scenario and could lead towards an equity market sell off.
The point I would like to convey is the perceived “safety” of an asset allocation can be fleeting at times and our goal as a firm is to strive to limit losses during down years to the best of our ability while keeping you invested through market cycles. If we can help prevent losses during the down years, we can more easily strive to achieve financial success for our clients and strive to make the journey towards financial freedom more enjoyable.
Be careful out there,
Jean Paul
The opinions voiced in this material are for general information only and are not intended to provide specific advice or recommendations for any individual. Economic forecasts set forth may not develop as predicted and there can be no guarantee that strategies promoted will be successful. No strategy, including asset allocation or Modern Portfolio Theory, assures success or protects against loss. There is no guarantee that a diversified portfolio will enhance overall returns or outperform a non-diversified portfolio. Diversification does not protect against market risk.
All performance referenced is historical and is no guarantee of future results. All indices are unmanaged and may not be invested into directly. The Standard & Poor’s 500 Index is a capitalization weighted index of 500 stocks designed to measure performance of the broad domestic economy through changes in the aggregate market value of 500 stocks representing all major industries.
Stock investing involves risk including loss of principal. The payment of dividends is not guaranteed. Companies may reduce or eliminate the payment of dividends at any given time.
Bonds are subject to market and interest rate risk if sold prior to maturity. Bond values will decline as interest rates rise and bonds are subject to availability and change in price. High yield/junk bonds (grade BB or below) are not investment grade securities, and are subject to higher interest rate, credit, and liquidity risks than those graded BBB and above. They generally should be part of a diversified portfolio for sophisticated investors.
Duration is a measure of the sensitivity of the price (the value of principal) of a fixed income investment to a change in interest rates. It is expressed as a number of years. Rising interest rates mean falling bond prices, while declining interest rates mean rising bond prices. The bigger the duration number, the greater the interest rate risk or reward for bond prices.
Government bonds and Treasury bills are guaranteed by the US government as to the timely payment of principal and interest and, if held to maturity, offer a fixed rate of return and fixed principal value.