 December 28, 2016 by Jean Paul Lagarde – One could say this is the year of the circus …
In order to gain insight into the true strength of the economy, we must strive to understand aggregate demand, which is to a large degree, a function of the U.S. consumer and their disposition to spending. The reality is that many consumers are workers themselves, and because of that, jobs, wages, and hours affect their confidence and thus consumption. Workers are, generally speaking, the last segment to benefit from an improving economy and can thus be labeled a relatively late cycle indicator. This is due to the fact that, at the beginning of an economic cycle which emerges from the depths of a recession, workers generally lack confidence, being relatively downtrodden, in the face of high unemployment and a scarcity of jobs in absolute terms as well as a scarcity of ideal jobs – those that are full-time and/or better paying.
As the cycle begins, workers do not share in as much of the economic fruit since wages are lower, and head counts are lean. Instead, the increased revenues benefit the corporations first, leading to expanding profit margins. With the increased earnings, companies begin to invest in research and development, capital and equipment, et cetera – although not as much in this cycle due to the adverse effects of the Federal Reserve’s Quantitative Easing (QE) program and excessively accommodative policy. That said, as the economy continues, businesses start hiring to fill the gaps to meet increased demand and unemployment begins to drop as jobs are created. Once the pool of eligible workers begins to dry up, businesses begin competing for talent and wages start to increase at an accelerating rate. With increased jobs, increased hours, and increased pay, consumers become increasingly confident and spend.
The rub is that as companies have to hire more employees and spend more on wages, their profit margins begin to shrink from the cycle peak (which occurred at the beginning of this cycle). As these profit margins compress, which might be further exacerbated by increased borrowing costs as interest rates climb, companies are forced to cut jobs which hurts consumer confidence and, in turn, causes a reduction in spending and the cycle ends in a recession.
As things stand, which we outlined in our September Investment Commentary entitled “Where’s the Beef?”, corporate profit margins are being squeezed by increased labor costs, and companies, for the most part, are not able to pass those increased costs through to the consumer in the form of material price increases. The pain has been bearable for the most part, at least for now, except for those industries experiencing the most output price deflation such as energy, industrials, and manufacturing (early cycle industries). Jobs have been lost in those areas. Compounding the problem is asset impairments in the energy industry. For example, oil and gas reserves are worth a fraction of what they were when oil was above $100/barrel. As assets are impaired, banks and private lenders are less inclined to lend which curtails their ability to stay afloat with cheap credit.
As we can see in the following graph corporate profit margins peaked in the second half of 2014 which caused employment growth to peak and slow. Peak employment growth was 2.4% in February 2015. As corporations experience diminishing profit margins, they slow down the pace of hiring. Of note, once employment growth peaks, it always falls below zero which causes the cycle to come to a close.
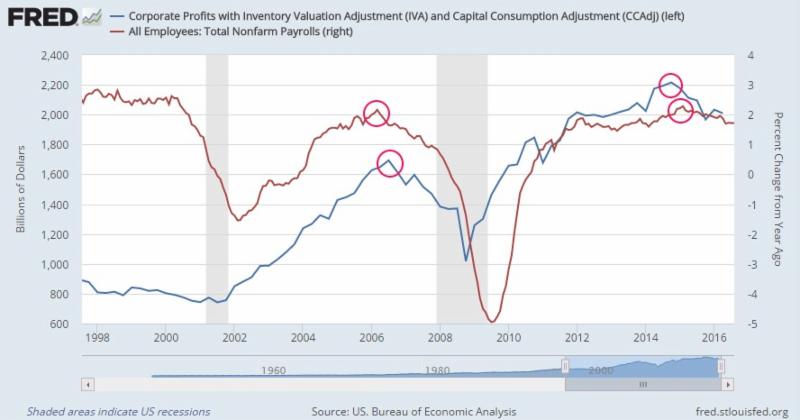
Figure 1: Corporate Profit Margins Decline Resulting in Non-Farm Payroll Growth Slowing
The chart below illustrates that as companies add jobs and compete for talent, wages increase which puts pressure on margins which results in slower growth in hiring.
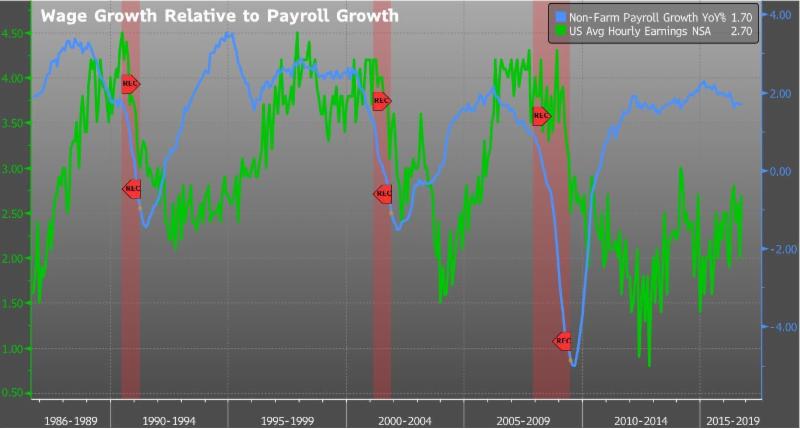
Figure 2: Wage Growth Accelerates at the Consequence of Slowing Payroll Growth (Red shaded areas indicate US recessions.)
In addition to job growth slowing, we are observing that average hours worked has been gradually slowing.
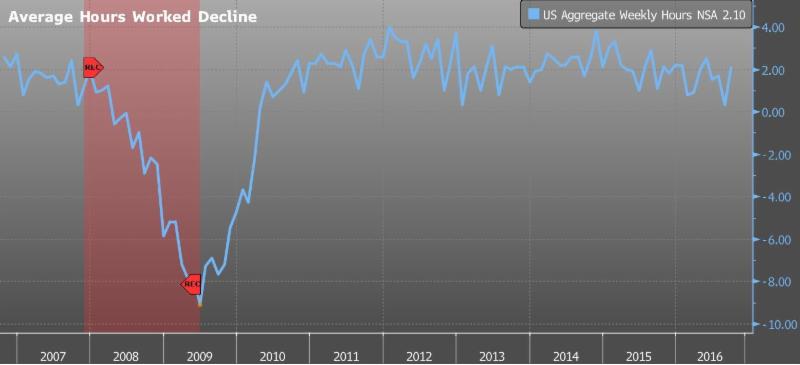
Figure 3: Average Hours Worked Decline (Red shaded areas indicate US recessions.)
Lastly, worker productivity has been in decline and negative for three quarters due to the fact that we have had relatively low capital investment this cycle – as a result of QE – which has led to this decline in productivity.
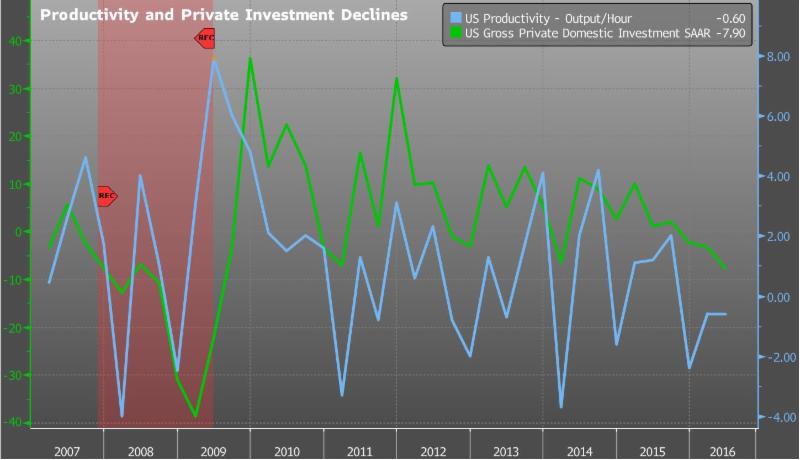
Figure 4: Productivity Declines as Private Investment Declines (Red shaded areas indicate US recessions.)
Output or GDP is a result of production, which is derived from the mathematical product of total hours worked and productivity, with total hours being a product of weekly hours and the total number of jobs. Thus, if job growth is slowing (non-farm payrolls), hours worked are declining, and productivity (how much can be produced per labor hour), GDP, which is the product of all of those factors, will mathematically decline.
The following chart shows the decline in productivity which has been negative for three quarters, as well as the decline in hours worked, non-farm payroll growth and the commensurate decline in GDP.
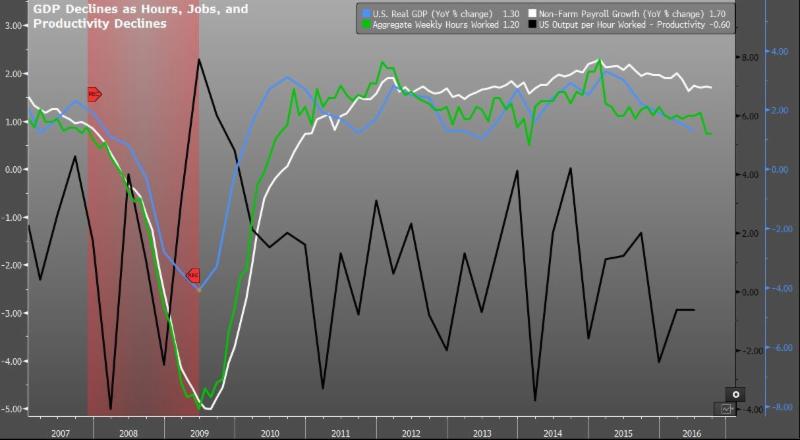
Figure 5: GDP as a Product of Hours, Jobs, and Productivity (Red shaded areas indicate US recessions.)
What does all this mean? I believe we are in the last inning of this economic expansion barring a major tax cut, an infrastructure spending spree that we probably cannot afford on a Federal level, or some other positive Force Majeure. With that said the current 1.4% GDP growth pales in comparison to the 5% growth (quarter over quarter annualized) in the second half of 2014, but continued easy monetary policy might keep us above the 1% water line for longer than we would have been in a sans QE world that would have likely already dipped into a recession.
As a result of abnormally, policy induced, interest rates, thanks to QE, many companies have been able to raise cash by selling bonds to yield starved investors. One must keep in mind that yield starved investors are a direct result of excessively loose monetary policy, and, in a sans QE world, they would be relatively happy with returns from relatively safer instruments such as U.S. Government bonds and investment grade credit. Back to the point about our currently reality, a relatively high percentage of these companies are dubbed “high yield” since they are not investment grade in the eyes of Moody’s or Standard and Poor’s ratings agencies. The fact that these non-investment grade companies with relatively unfavorable outlooks are able to raise money in the first place, and at a lower rate than what would be expected in a non-QE non-yield starved world, is perpetuating the cycle. These influxes of cash are able to sustain the circus for now, even though the big tent is beginning to cave in on itself much like the Vikings Stadium roof did in a spectacular fashion during the winter of 2010. One has to ask, even with the reduced level of interest, are these companies putting this capital to work in a manner that is above the cost of capital? If not, these companies will continue to destroy value and have, therefore, only prolonged the inevitable gravity of cutting jobs or worse ending up in bankruptcy.
QE’s consequences, whether intended or not, are far reaching and it is just a reality of the world we live in today. My assertion is that even with continued loose monetary policy, it is extremely unlikely that we will regain the +2% growth on a sustained basis, without a major unpredictable positive force outlined above.
The team of Faubourg Private Wealth are dedicated long-term investors. We believe that staying invested, while mitigating risk to reduce downside exposure, is the key to success. We adhere strictly to the belief that the best way to achieve investment goals is to limit losses in downturns simply because it can take years to overcome a substantial loss. Let’s not forget that during the height of the financial crisis, the S&P 500 was down 57%. Thus, if we limit to a great degree our losses in such downturns, we only need to participate in a relatively small percentage of gains in any particular up year. And this year, in our opinion, given asset price increases driven by central bank stimulus combined with a slowing economy, is an ideal one in which to be extremely careful.
The opinions voiced in this material are for general information only and are not intended to provide specific advice or recommendations for any individual. Economic forecasts set forth may not develop as predicted and there can be no guarantee that strategies promoted will be successful. No strategy assures success or protects against loss. Investing involves risk including loss of principal. All performance referenced is historical and is no guarantee of future results.
Bonds are subject to market and interest rate risk if sold prior to maturity. Bond values will decline as interest rates rise and bonds are subject to availability and change in price. High yield/junk bonds (grade BB or below) are not investment grade securities, and are subject to higher interest rate, credit, and liquidity risks than those graded BBB and above. They generally should be part of a diversified portfolio for sophisticated investors.
Government bonds and Treasury bills are guaranteed by the US government as to the timely payment of principal and interest and, if held to maturity, offer a fixed rate of return and fixed principal value.