
 December 28, 2016 by Jean Paul Lagarde – Facing the second longest bull market since the great depression, we question the foundational footings of such a long streak. Have we entered into a new era of productivity or prosperity in the U.S.? We think not. If we take the pulse of this economy, we will see that several industries are actually quite weak and in an earnings recession, that various indicators are pointing to continued slow growth or even contraction in aggregate, and that the almighty consumer might not have for much longer the Herculean strength required to defy economic gravity and prop up U.S. economic “growth.”
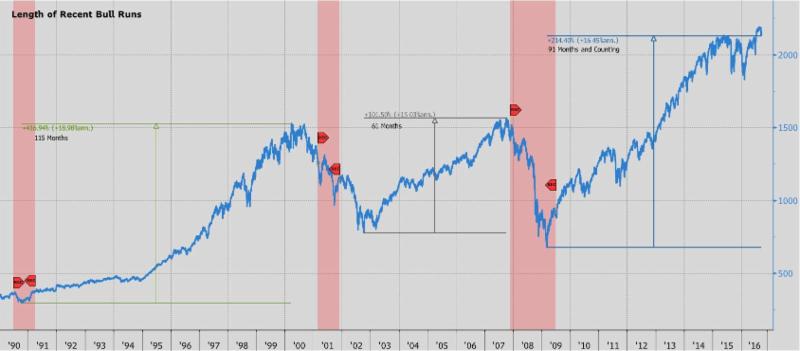
Figure 1 Equity Bull Market Second Longest Since Great Depression as Shown by S&P 500. Three Periods Indicated 10/11/90 – 3/23/00, 10/09/02 – 10/13/07, 3/09/09 – 09/13/16 (via Bloomberg)
It is true that consumers today are fairly confident. The unemployment rate has reached a low of 4.8%, yet wages have only ticked up moderately since the great recession. Financials and energy are in a clear earnings recession, and classic late cycle sectors – utilities, consumer staples, materials – are not. Consumer discretionary stocks have also sustained gains. By looking at each sector’s performance relative to the broad market in an attempt to glean the stage of the current economic cycle, we see indications of both a late cycle and a recessionary economy and this is showing up in our Gross Domestic Product.
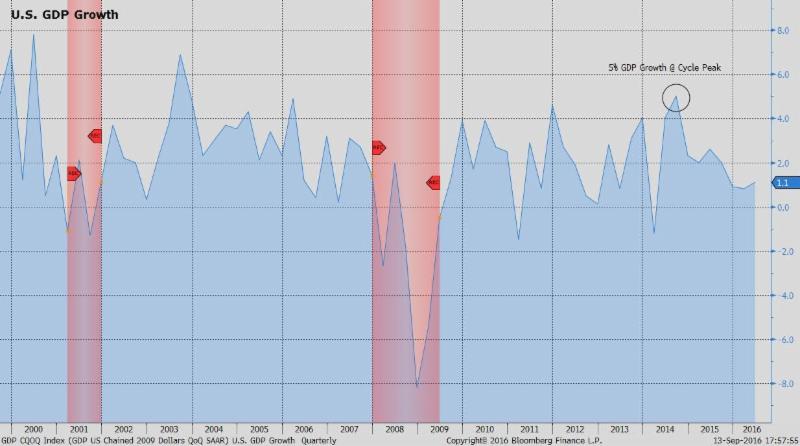
Figure 2 U.S. GDP Growth Continues to Trend Lower from Cycle Peak (via Bloomberg)
GDP – the value of goods and services produced within U.S. borders – posted a weak 1Q annualized growth rate of 0.8% and a 2Q rate of 1.1%. Unsurprisingly, GDP peaked at the cycle high when corporate profit margins peaked in the second half of 2014 and has been trending down since then. The largest 500 companies in the U.S. (S&P 500) have posted 5 consecutive quarters of revenue and profit decline and the prospects of a negative 3rd and 4th quarter this year are gaining in probability. Additionally, balance sheets are becoming more bloated as companies have repurchased shares to meet or beat (lowered) analyst expectations, and/or to purchase other companies.
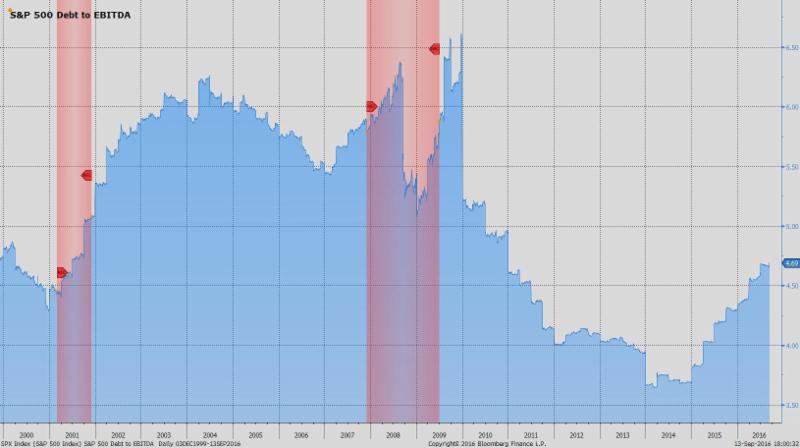
Figure 3 S&P 500 Debt to EBITDA (Earnings Before Interest, Taxes, Depreciation and Amortization) Continues to Climb (via Bloomberg)
We are also seeing weakness in the prospects for future business, looking at the manufacturing Purchasing Managers Index (PMI) – surveys focused on forward looking expectations – that indicate economic contraction in the manufacturing sector.
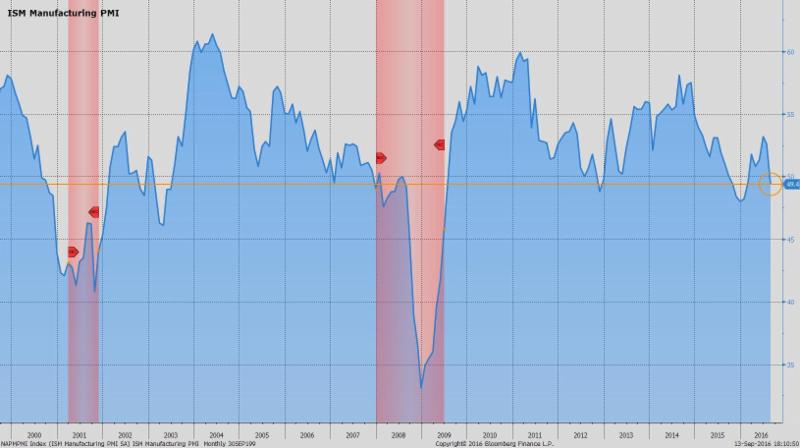
Figure 4 ISM Manufacturing PMIs Decline Sharply Indicating Retraction (via Bloomberg)
If we look at new orders, a subset of the PMI survey, we see that those fell sharply as well which also indicate future weakness.
weakness.
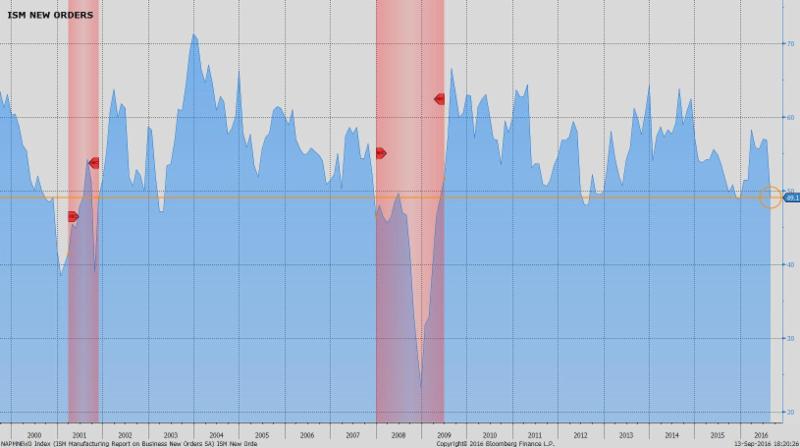
Figure 5 ISM New Orders Indicate Future Weakness (via Bloomberg)
While the manufacturing sector is a smaller part of the overall economy relative to the services sector, manufacturing does tend to lead declines in the services sector. Figure 6 below also shows that non-manufacturing or services are also on the decline.
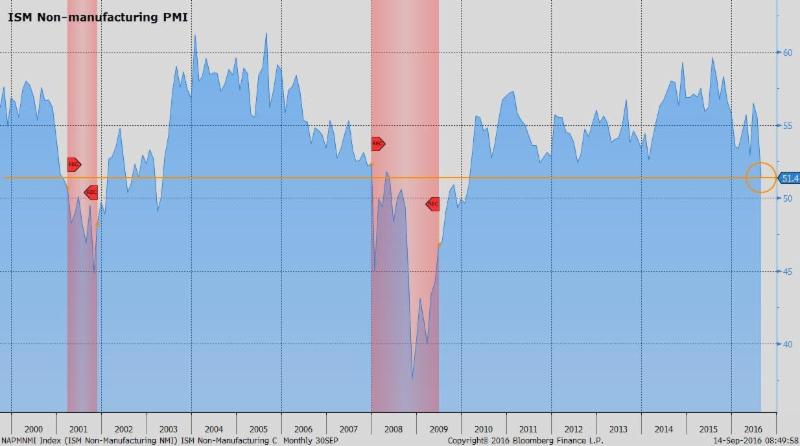
Figure 6 ISM Non-Manufacturing PMI (Services) Also Indicates Weakness (via Bloomberg)
In addition, August vehicle sales were relatively lackluster according to Ward’s Total Vehicle Sales report released 8/31/16 which showed that the seasonally adjusted annual rate of automobile sales fell 4.8% from July to 16.91 million and fell 4.4% relative to the same period last year. Existing home sales (90% of housing market) also declined 1.6% year-over-year and 3.2% from July. These factors hint that consumer spending, at least for big ticket items, may be retreating.
The general level of price, another way to gauge how “hot” the economy is running, is tepid at best with CPI in July tracking at 0.8% growth year-over-year and 2.2% for the core which strips out volatile food and energy prices. PCE, the Federal Reserve’s preferred metric of price, increased 0.8% and 1.6% for core. The FED’s minimum target for price growth is 2% annually – we are clearly in no danger of exceeding this level and have not been for some time.
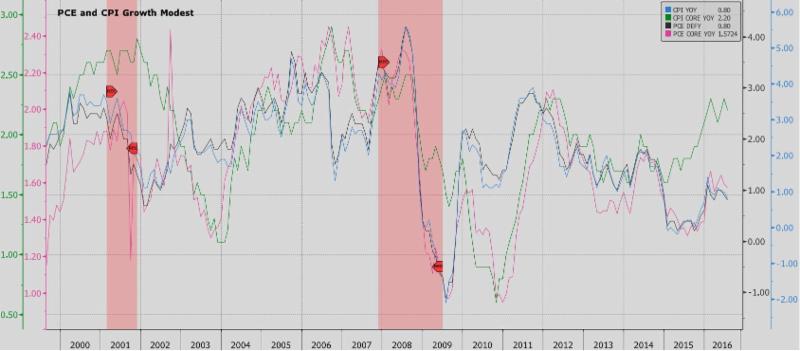
Figure 7 Excluding Core CPI Most Price Metrics Far Below FED Target (via Bloomberg)
Continuing along, if we look at the prevailing level of interest rates, a rising interest rate, and a rising currency for that matter, are signs of economic strength, yet today we are flirting with record low interest rates. Rates vary relative to the time period of the investment with shorter maturities paying less interest than those locking their money up for longer periods of time as they are exposed to a much greater inflation risk. With that said, in a strong economy, inflation expectations are generally higher than those in a weak economy, since strong economies raise the prices of goods and services as consumers have more disposable income. Thus, the interest rate on a 20 or 30-year security will be measurably higher than those with maturities of less than a year or two. This difference between the long and short end of rates is called the yield curve. The steeper the curve, the stronger the economy; however, the flatter the curve the weaker the economy. So where are we today? A relatively flat yield curve.
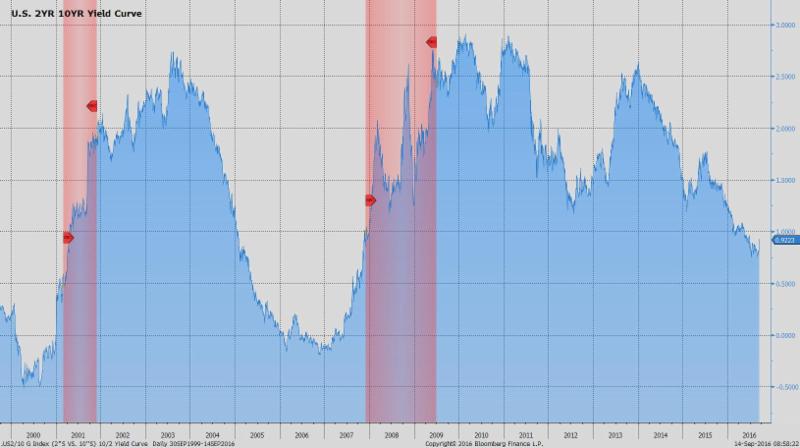
Figure 8 Yield Curve Between 2 Year and 10 Year Government Securities Flattening – A Sign of a Cooling Economy (via Bloomberg)
So apart from the fact that we have low unemployment and some minor amount of wage inflation, where’s the beef? Why are stocks partying like it’s 1999 reaching new highs akin the euphoria of the dawn of the internet? Is this justified? Again, we think not. The foundational footings for this dramatic increase in stocks and bonds are shaky at best, and our fear is that if the foundation is not there for the rise in valuations, it won’t be there to prevent the fall either.
A conservative approach to gauging the general level of stocks in an effort to detect bubbles in valuations is to measure the total U.S. market capitalization relative to U.S. GDP or total economic output. When GDP is strong stocks deserve higher valuations, and when GDP is weak, lower valuations are warranted. Figure 9 below illustrates that this ratio is at the high end of the range having climbed 88.1% since the depths of the financial crisis. This also implies that stocks could fall 46.8% if the ratio was to match the prior low in 2009.
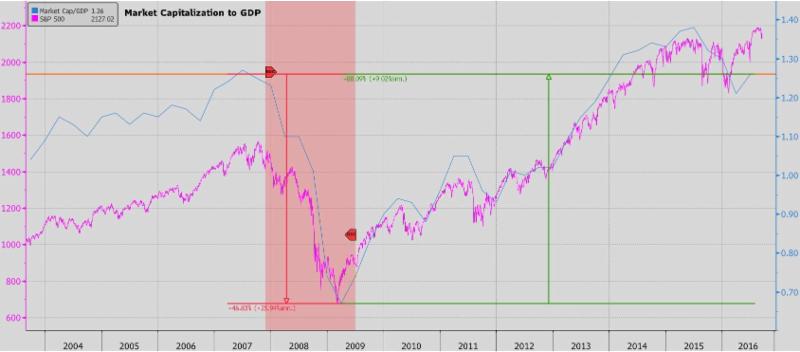
Figure 9 Total U.S. Market Cap to GDP Showing that Stocks Could Fall 46.8% if the Ratio Fell to the Low of 2009 and that the Ratio has Increased 88.1% Since the Great Recession as of the last GDP Report Dated 6/30/16 when the S&P Closed at 2098.86 Versus the Close on 9/13/16 of 2127.02 (via Bloomberg)
The problem with stock valuations being at or close to all-time highs is that investors are paying more and more for a future steam of income. The more they pay, the worse the future return becomes if the investor holds the security in perpetuity, rather than attempting to sell the security at a higher price to someone else. So why are investors satisfied with paying more and more, even though their return percentage is getting slimmer and slimmer? The fact is investors are starved for yield. They are desperate for a return since interest rates are so low. This has caused investors to shy away from less risky securities like U.S. government bonds and investment grade corporate debt, and seek riskier asset classes such as equities and high yield (junk) bonds that have the potential to offer a greater reward.
Keep in mind that professional money managers have bosses and clients to whom they have to report and pensions have commitments to honor for retirees and future retirees. Unfortunately, many of these pensions have 7%-8% annual returns on their investments baked into calculations of solvency. According to Hank Kim, executive director at the National Conference of Public Employee Retirement Systems, who was quoted in a Financial Times article by Attracta Mooney earlier this year titled
US Faces ‘Disastrous’ $3.4tn Pension Funding Hole, “public pension funds set their return targets at 7.5 per cent because that is what they have been able to achieve historically.” With the 10-year government securities yielding 1.69% per year, how does one achieve a 7-8% return?
As of the close on September 13th, 2016, the average OAS (option adjusted spread) of the Bloomberg Barclays U.S. High Yield Index over the risk-free rate (a synthetic risk free rate comparable to the U.S. 10-year Treasury that is duration matched) is 4.98%, while the S&P 500 index has a dividend yield of 2.1% (via Bloomberg). With both asset classes you have the potential of appreciation, but given their high valuations we would argue that there is an even a greater chance of depreciation. The amount of potential appreciation we think is dwarfed by the potential downside risk making the risk/reward proposition unfavorable.
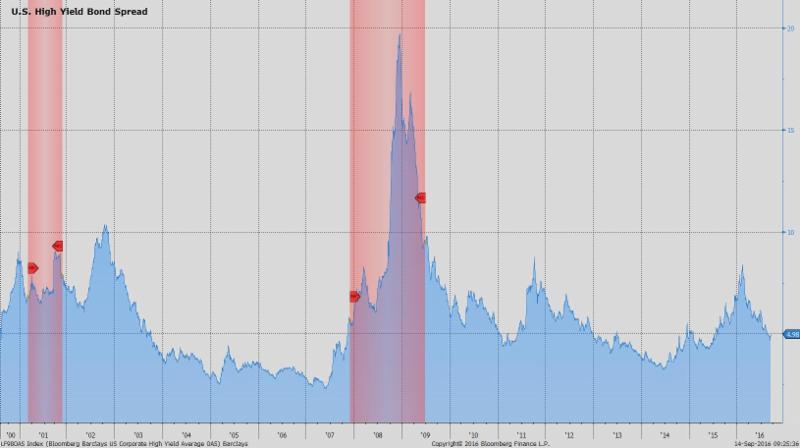
Figure 10 U.S. High Yield Bond Spread Narrowing Lately Despite Rising Credit Risks (via Bloomberg)
In a normally functioning economy bonds and stocks exhibit an inverse relationship. When times are good and economic prospects are improving, stocks go up in value as the increased risk of owning equity is less daunting given the attractive return potential, yet when investors are worried and less inclined to speculate, the value of equities decline and the value of the less risky, more secure bonds go up in value. Today, however, we are currently experiencing equities and bonds going up at the same time. Why?
Since the great recession, the Federal Reserve, along with the European Central Bank, Bank of Japan, the People’s Bank of China, the Bank of England (post-Brexit), among many other smaller banks, have embarked on varying programs which include the purchase of government securities, mortgage backed securities, and private bonds in an effort to reduce the prevailing level of interest to artificially low levels in attempt to spur their economies. Unfortunately, much like throwing gasoline on a fire, the effects are short-lived and require continued actions to maintain the effect. This has unfortunately been going on for years in some cases, with governments taking on substantial debt to accomplish this.
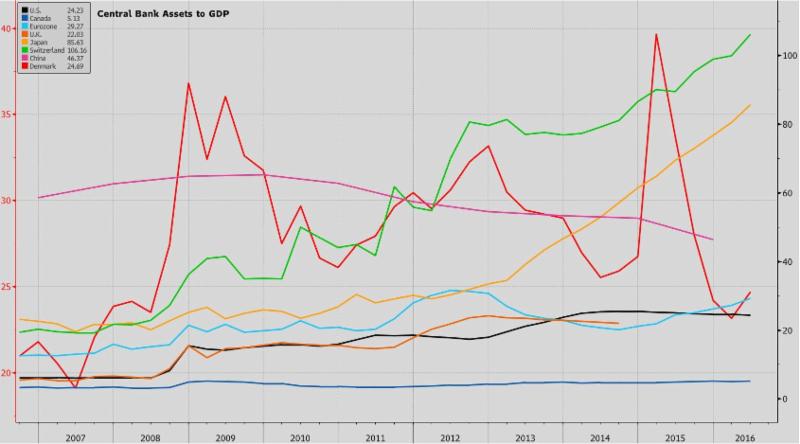
Figure 11 Central Bank Assets Continue to Climb and in Some Cases Assets Exceed Entire Yearly Economic Output (via Bloomberg)
Worse, some countries such as Germany and Japan actually have negative interest rates, a concoction devised to spur consumers and corporations to spend (or invest) rather than sitting on cash reserves. In fact, there are over $13.4 trillion of government securities that offer negative yields around the world. There also are many countries hovering around 0% that along with their negative yielding brethren find our junk bonds, our 2.1% S&P 500 dividend yield, and our 1.69% yielding 10-year treasuries attractive even though valuations are in nose-bleed territory.
This artificially low level of interest has dramatically increased paper “wealth” as measured by the value of trading stocks and bonds as well as other assets such as home prices. Stocks have more than doubled since the great recession, and houses in some markets and price levels have more than doubled. You would think that wages would have increased substantially to propel assets, particularly housing, to such levels. Quite the contrary, the reality is that wages have only gone up modestly since the recession. Sadly, this dramatic increase in paper wealth and home prices do not reflect the underlying strength of the economy and are unsustainable in our view over the long-term.
In regards to the economy itself, we believe we are in a very late stage expansion propped up primarily by the strength of the consumer. Corporate profit margins will continue to shrink from their peak in 2014 caused by ever increasing labor costs and declining worker productivity – a systemic problem we have experienced since before 2008 due to a reluctance of corporations to invest in new capital. This profit decline combined with swelling balance sheets will ultimately result in layoffs. Job losses will in turn create a significant decline in consumer confidence, and a resulting reduction in spending. Given that the majority of the economy is consumer oriented, we think a recession is on the horizon which could cause a meaningful decline in equity prices and potentially bond prices.
Barring a major economic breakthrough, a massive tax cut, entitlement reform, or a substantial increase in infrastructure spending – doubtful given the current level of U.S. debt – we feel confident in our assessment. That said, we are positioned to benefit from an increase in stocks if the run should continue which would likely be driven by further central bank stimulus. We will, however, not participate in 100% of the gains as we have the mechanisms built into the portfolios that aim to help buffer losses in market downturns for when the foundational footings of this economy fail.
We are indeed long-term investors and believe that staying invested, while intelligently mitigating risk to reduce downside exposure, is the key to success. We adhere strictly to the belief that the best way to achieve investment goals is to limit losses in downturns simply because it can take years to overcome a substantial loss. During the height of the financial crisis the S&P 500 was down 57%. Thus, if we limit to a great degree our losses in such downturns, we only need to participate in a relatively small percentage of gains in any particular up year. And this year, in our opinion, given asset price increases driven by central bank stimulus combined with a slowing economy, is an ideal one in which to be extremely careful.
The opinions voiced in this material are for general information only and are not intended to provide specific advice or recommendations for any individual. Economic forecasts set forth may not develop as predicted and there can be no guarantee that strategies promoted will be successful. No strategy assures success or protects against loss. All performance referenced is historical and is no guarantee of future results.
All indices are unmanaged and may not be invested into directly. The Standard & Poor’s 500 Index is a capitalization weighted index of 500 stocks designed to measure performance of the broad domestic economy through changes in the aggregate market value of 500 stocks representing all major industries.
Stock investing involves risk including loss of principal. The payment of dividends is not guaranteed. Companies may reduce or eliminate the payment of dividends at any given time.
Bonds are subject to market and interest rate risk if sold prior to maturity. Bond values will decline as interest rates rise and bonds are subject to availability and change in price. High yield/junk bonds (grade BB or below) are not investment grade securities, and are subject to higher interest rate, credit, and liquidity risks than those graded BBB and above. They generally should be part of a diversified portfolio for sophisticated investors.
Government bonds and Treasury bills are guaranteed by the US government as to the timely payment of principal and interest and, if held to maturity, offer a fixed rate of return and fixed principal value.